grep日志:Java Exception异常堆栈显示不全问题
在某些情况下,我们会用grep搜索Java应用的报错日志,通常错误是以一个异常堆栈的形式呈现。grep有个一个尴尬:由于换行,与关键字相关的Exception异常堆栈,grep后就看不到了,而异常堆栈又是我们最关心的内容。
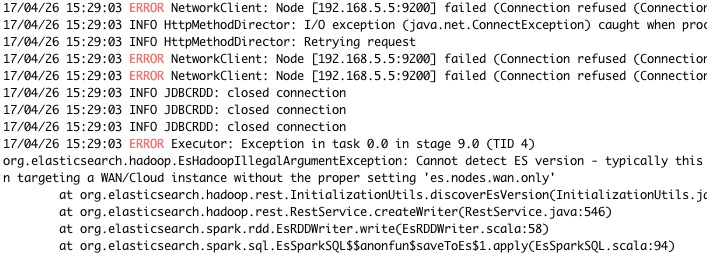
比如下面的test.log日志(摘自 https://unix.stackexchange.com/questions/361389/how-can-i-do-a-stack-trace-using-grep-and-regex/496220#496220) :
17/04/26 15:29:03 INFO HttpMethodDirector: Retrying request
17/04/26 15:29:03 ERROR NetworkClient: Node [192.168.5.5:9200] failed (Connection refused (Connection refused)); no other nodes left - aborting...
17/04/26 15:29:03 INFO HttpMethodDirector: I/O exception (java.net.ConnectException) caught when processing request: Connection refused (Connection refused)
17/04/26 15:29:03 INFO HttpMethodDirector: Retrying request
17/04/26 15:29:03 ERROR NetworkClient: Node [192.168.5.5:9200] failed (Connection refused (Connection refused)); no other nodes left - aborting...
17/04/26 15:29:03 ERROR NetworkClient: Node [192.168.5.5:9200] failed (Connection refused (Connection refused)); no other nodes left - aborting...
17/04/26 15:29:03 INFO JDBCRDD: closed connection
17/04/26 15:29:03 INFO JDBCRDD: closed connection
17/04/26 15:29:03 INFO JDBCRDD: closed connection
17/04/26 15:29:03 ERROR Executor: Exception in task 0.0 in stage 9.0 (TID 4)
org.elasticsearch.hadoop.EsHadoopIllegalArgumentException: Cannot detect ES version - typically this happens if the network/Elasticsearch cluster is not accessible or when targeting a WAN/Cloud instance without the proper setting 'es.nodes.wan.only'
        at org.elasticsearch.hadoop.rest.InitializationUtils.discoverEsVersion(InitializationUtils.java:250)
        at org.elasticsearch.hadoop.rest.RestService.createWriter(RestService.java:546)
        at org.elasticsearch.spark.rdd.EsRDDWriter.write(EsRDDWriter.scala:58)
        at org.elasticsearch.spark.sql.EsSparkSQL$$anonfun$saveToEs$1.apply(EsSparkSQL.scala:94)
        at org.elasticsearch.spark.sql.EsSparkSQL$$anonfun$saveToEs$1.apply(EsSparkSQL.scala:94)
        at org.apache.spark.scheduler.ResultTask.runTask(ResultTask.scala:70)
        at org.apache.spark.scheduler.Task.run(Task.scala:85)
        at org.apache.spark.executor.Executor$TaskRunner.run(Executor.scala:274)
        at java.util.concurrent.ThreadPoolExecutor.runWorker(ThreadPoolExecutor.java:1142)
        at java.util.concurrent.ThreadPoolExecutor$Worker.run(ThreadPoolExecutor.java:617)
        at java.lang.Thread.run(Thread.java:745)
Caused by: org.elasticsearch.hadoop.rest.EsHadoopNoNodesLeftException: Connection error (check network and/or proxy settings)- all nodes failed; tried [[192.168.5.5:9200]]
        at org.elasticsearch.hadoop.rest.NetworkClient.execute(NetworkClient.java:150)
        at org.elasticsearch.hadoop.rest.RestClient.execute(RestClient.java:444)
        at org.elasticsearch.hadoop.rest.RestClient.execute(RestClient.java:424)
        at org.elasticsearch.hadoop.rest.RestClient.execute(RestClient.java:428)
        at org.elasticsearch.hadoop.rest.RestClient.get(RestClient.java:154)
        at org.elasticsearch.hadoop.rest.RestClient.remoteEsVersion(RestClient.java:609)
        at org.elasticsearch.hadoop.rest.InitializationUtils.discoverEsVersion(InitializationUtils.java:243)
        ... 10 more
17/04/26 15:29:03 INFO CoarseGrainedExecutorBackend: Got assigned task 12
17/04/26 15:29:03 INFO Executor: Running task 0.1 in stage 0.0 (TID 12)
17/04/26 15:29:03 INFO CoarseGrainedExecutorBackend: Got assigned task 13
17/04/26 15:29:03 INFO TorrentBroadcast: Started reading broadcast variable 0
17/04/26 15:29:03 INFO Executor: Running task 0.1 in stage 2.0 (TID 13)
假如我们要搜索”ERROR”关键字的日志,搜索结果如下,Exception堆栈全部丢失:
17/04/26 15:29:03 ERROR NetworkClient: Node [192.168.5.5:9200] failed (Connection refused (Connection refused)); no other nodes left - aborting...
17/04/26 15:29:03 ERROR NetworkClient: Node [192.168.5.5:9200] failed (Connection refused (Connection refused)); no other nodes left - aborting...
17/04/26 15:29:03 ERROR NetworkClient: Node [192.168.5.5:9200] failed (Connection refused (Connection refused)); no other nodes left - aborting...
17/04/26 15:29:03 ERROR Executor: Exception in task 0.0 in stage 9.0 (TID 4)
遇到这种情况,一般grep后会再用less/more/vi等工具打开重新搜索。但并不好,一来效率很低,二来可能日志量如果很大,这些日志会极为分散,上下对比很让人抓狂。
不完美的grep -A n
当然grep也有一个好用的功能,显示匹配行的上下文,比如grep -A 5 ERORR test.log,搜索结果如下:
但还是有两个问题:
- 首先,第2和3行的日志是不相关的,但因为在第一行ERROR日志的5行之内,也被显示了。
- 并且,异常堆栈依然没有显示完整!
使用awk
我研究了grep的用法,也没有找到一个理想的办法,只能祭出awk了,代码示例如下:
full_grep()
{
	local keyword=$1
	# mark the new line
	# local newLinePattern="^d{2}\/d{2}\/d{2} d{2}:d{2}:d{2}"
	local newLinePattern="^[0-9]{2}\/[0-9]{2}\/[0-9]{2} [0-9]{2}:[0-9]{2}:[0-9]{2}"

	cat | awk  '
			BEGIN{
				isFound = "no"
			}

			# match lines with keyword
			{
				# if match print the line
				if($0~/'"$keyword"'/)
				{
					print $0
					isFound="yes"
				}
				# if new line begin
				else if($0~/'"$newLinePattern"'/)
				{
					isFound="no"
				}
				# if no line found, print continuely
				else if(isFound=="yes")
				{
					print $0
				}
			}
			'
}


full_grep $@
将上述代码newLinePattern修改为实际的正则表达式(多半是各种格式的日期),保存为fullgrep.sh,然后执行 cat test.log| fullgrep ERROR。
逻辑是,通过awk匹配关键字行;同时,每一行都通过newLinePattern来判断是否是为==真正的==新一行日志(这里的标准就是有没有日期开头)。如果搜索到了ERROR,并且不是真正的新一行日志,则持续的将其打印出来。结果如下:
17/04/26 15:29:03 ERROR NetworkClient: Node [192.168.5.5:9200] failed (Connection refused (Connection refused)); no other nodes left - aborting...
17/04/26 15:29:03 ERROR NetworkClient: Node [192.168.5.5:9200] failed (Connection refused (Connection refused)); no other nodes left - aborting...
17/04/26 15:29:03 ERROR NetworkClient: Node [192.168.5.5:9200] failed (Connection refused (Connection refused)); no other nodes left - aborting...
17/04/26 15:29:03 ERROR Executor: Exception in task 0.0 in stage 9.0 (TID 4)
org.elasticsearch.hadoop.EsHadoopIllegalArgumentException: Cannot detect ES version - typically this happens if the network/Elasticsearch cluster is not accessible or when targeting a WAN/Cloud instance without the proper setting 'es.nodes.wan.only'
        at org.elasticsearch.hadoop.rest.InitializationUtils.discoverEsVersion(InitializationUtils.java:250)
        at org.elasticsearch.hadoop.rest.RestService.createWriter(RestService.java:546)
        at org.elasticsearch.spark.rdd.EsRDDWriter.write(EsRDDWriter.scala:58)
        at org.elasticsearch.spark.sql.EsSparkSQL$$anonfun$saveToEs$1.apply(EsSparkSQL.scala:94)
        at org.elasticsearch.spark.sql.EsSparkSQL$$anonfun$saveToEs$1.apply(EsSparkSQL.scala:94)
        at org.apache.spark.scheduler.ResultTask.runTask(ResultTask.scala:70)
        at org.apache.spark.scheduler.Task.run(Task.scala:85)
        at org.apache.spark.executor.Executor$TaskRunner.run(Executor.scala:274)
        at java.util.concurrent.ThreadPoolExecutor.runWorker(ThreadPoolExecutor.java:1142)
        at java.util.concurrent.ThreadPoolExecutor$Worker.run(ThreadPoolExecutor.java:617)
        at java.lang.Thread.run(Thread.java:745)
Caused by: org.elasticsearch.hadoop.rest.EsHadoopNoNodesLeftException: Connection error (check network and/or proxy settings)- all nodes failed; tried [[192.168.5.5:9200]]
        at org.elasticsearch.hadoop.rest.NetworkClient.execute(NetworkClient.java:150)
        at org.elasticsearch.hadoop.rest.RestClient.execute(RestClient.java:444)
        at org.elasticsearch.hadoop.rest.RestClient.execute(RestClient.java:424)
        at org.elasticsearch.hadoop.rest.RestClient.execute(RestClient.java:428)
        at org.elasticsearch.hadoop.rest.RestClient.get(RestClient.java:154)
        at org.elasticsearch.hadoop.rest.RestClient.remoteEsVersion(RestClient.java:609)
        at org.elasticsearch.hadoop.rest.InitializationUtils.discoverEsVersion(InitializationUtils.java:243)
        ... 10 more
-------------------------
本文采用 知识共享署名 4.0 国际许可协议(CC-BY 4.0)进行许可。转载请注明来源:https://imshuai.com/grep-show-full-java-exception-stack 欢迎指正或在下方评论。
毛帅
{Code, Thoughts, Sharing}